For the first two months, sight-reading gains are dramatic. A student who stops at every measure starts to phrase two or three measures at a time within weeks. Then somewhere around the sixth month, everyone says the same thing: "I don't feel like I'm getting any better." Practice time has not changed. The numbers have. Motivation collapses, and a lot of students quit here.
This pattern is not unique to music. In cognitive science, almost every skill follows the power law of practice. In Anderson's (1982) ACT framework, the relationship between practice and performance time is a steep early drop that flattens out as practice accumulates. More precisely, performance time decreases as a power function of the number of trials. The shape is mechanical. It is not about willpower or talent — it is what skill acquisition looks like.
Understanding the four segments of the sight-reading curve is what keeps students from misreading their own plateau.
Segment 1 — Onboarding (Months 1–2): Steep Climb
The fastest gains happen here. This is the cognitive stage in Anderson's (1982) model. The learner consciously applies explicit rules: note names, key signatures, beat groupings. Every action passes through working memory, which is slow and error-prone — but because it is conscious, new rules take effect immediately.
Weekly measurements show clean climbs: 60% → 75% → 82% accuracy. Five minutes a day is enough to feel progress. Motivation is highest here because the curve is steep.
 Figure 1: Learning curve from US airframe production during WWII. As cumulative output grows, per-unit labor time falls by a power law. Source: Wikimedia Commons / Public Domain.
Segment 2 — Stabilization (Months 3–6): Gentle Climb
The associative stage begins. Note recognition no longer needs conscious rule application — the learner processes the same information faster and more accurately, but the numerical change shrinks. Accuracy creeps: 82% → 87% → 90%. Internally there is a real sense of improvement, but the dashboard barely moves.
What matters in this segment is variety. Drilling the same patterns automates only those patterns — meet a new one, and you snap back to Segment 1. Deliberately mixing key signatures, meters, and fingering patterns is what makes the automation generalize.
Segment 3 — Plateau (Months 6–12): Apparent Stop
This is where most students quit. Accuracy holds around 90%. Reaction time looks flat. But apparent plateau and real plateau are not the same thing. During this period the learner's brain is rewiring for automation — surface metrics stop while internal processing reorganizes. It is common for a learner to sit at 90% for three months and then jump to 94% in a single week without changing anything they were doing.
To distinguish a true plateau from invisible progress, look at finer-grained metrics:
- Reaction-time variance: even if the mean is flat, falling variance means processing is becoming more consistent.
- Accuracy on weak notes: the average can hold while the bottom-five notes climb. That is progress.
- Accuracy in unfamiliar keys: if familiar keys are flat but new keys feel less foreign, generalization is happening.
If all three are flat, it is a real plateau. Then the answer is to deliberately raise the difficulty floor — uncommon meters (6/8, 5/4), new keys, longer phrases — to reintroduce cognitive load and force the next reorganization.
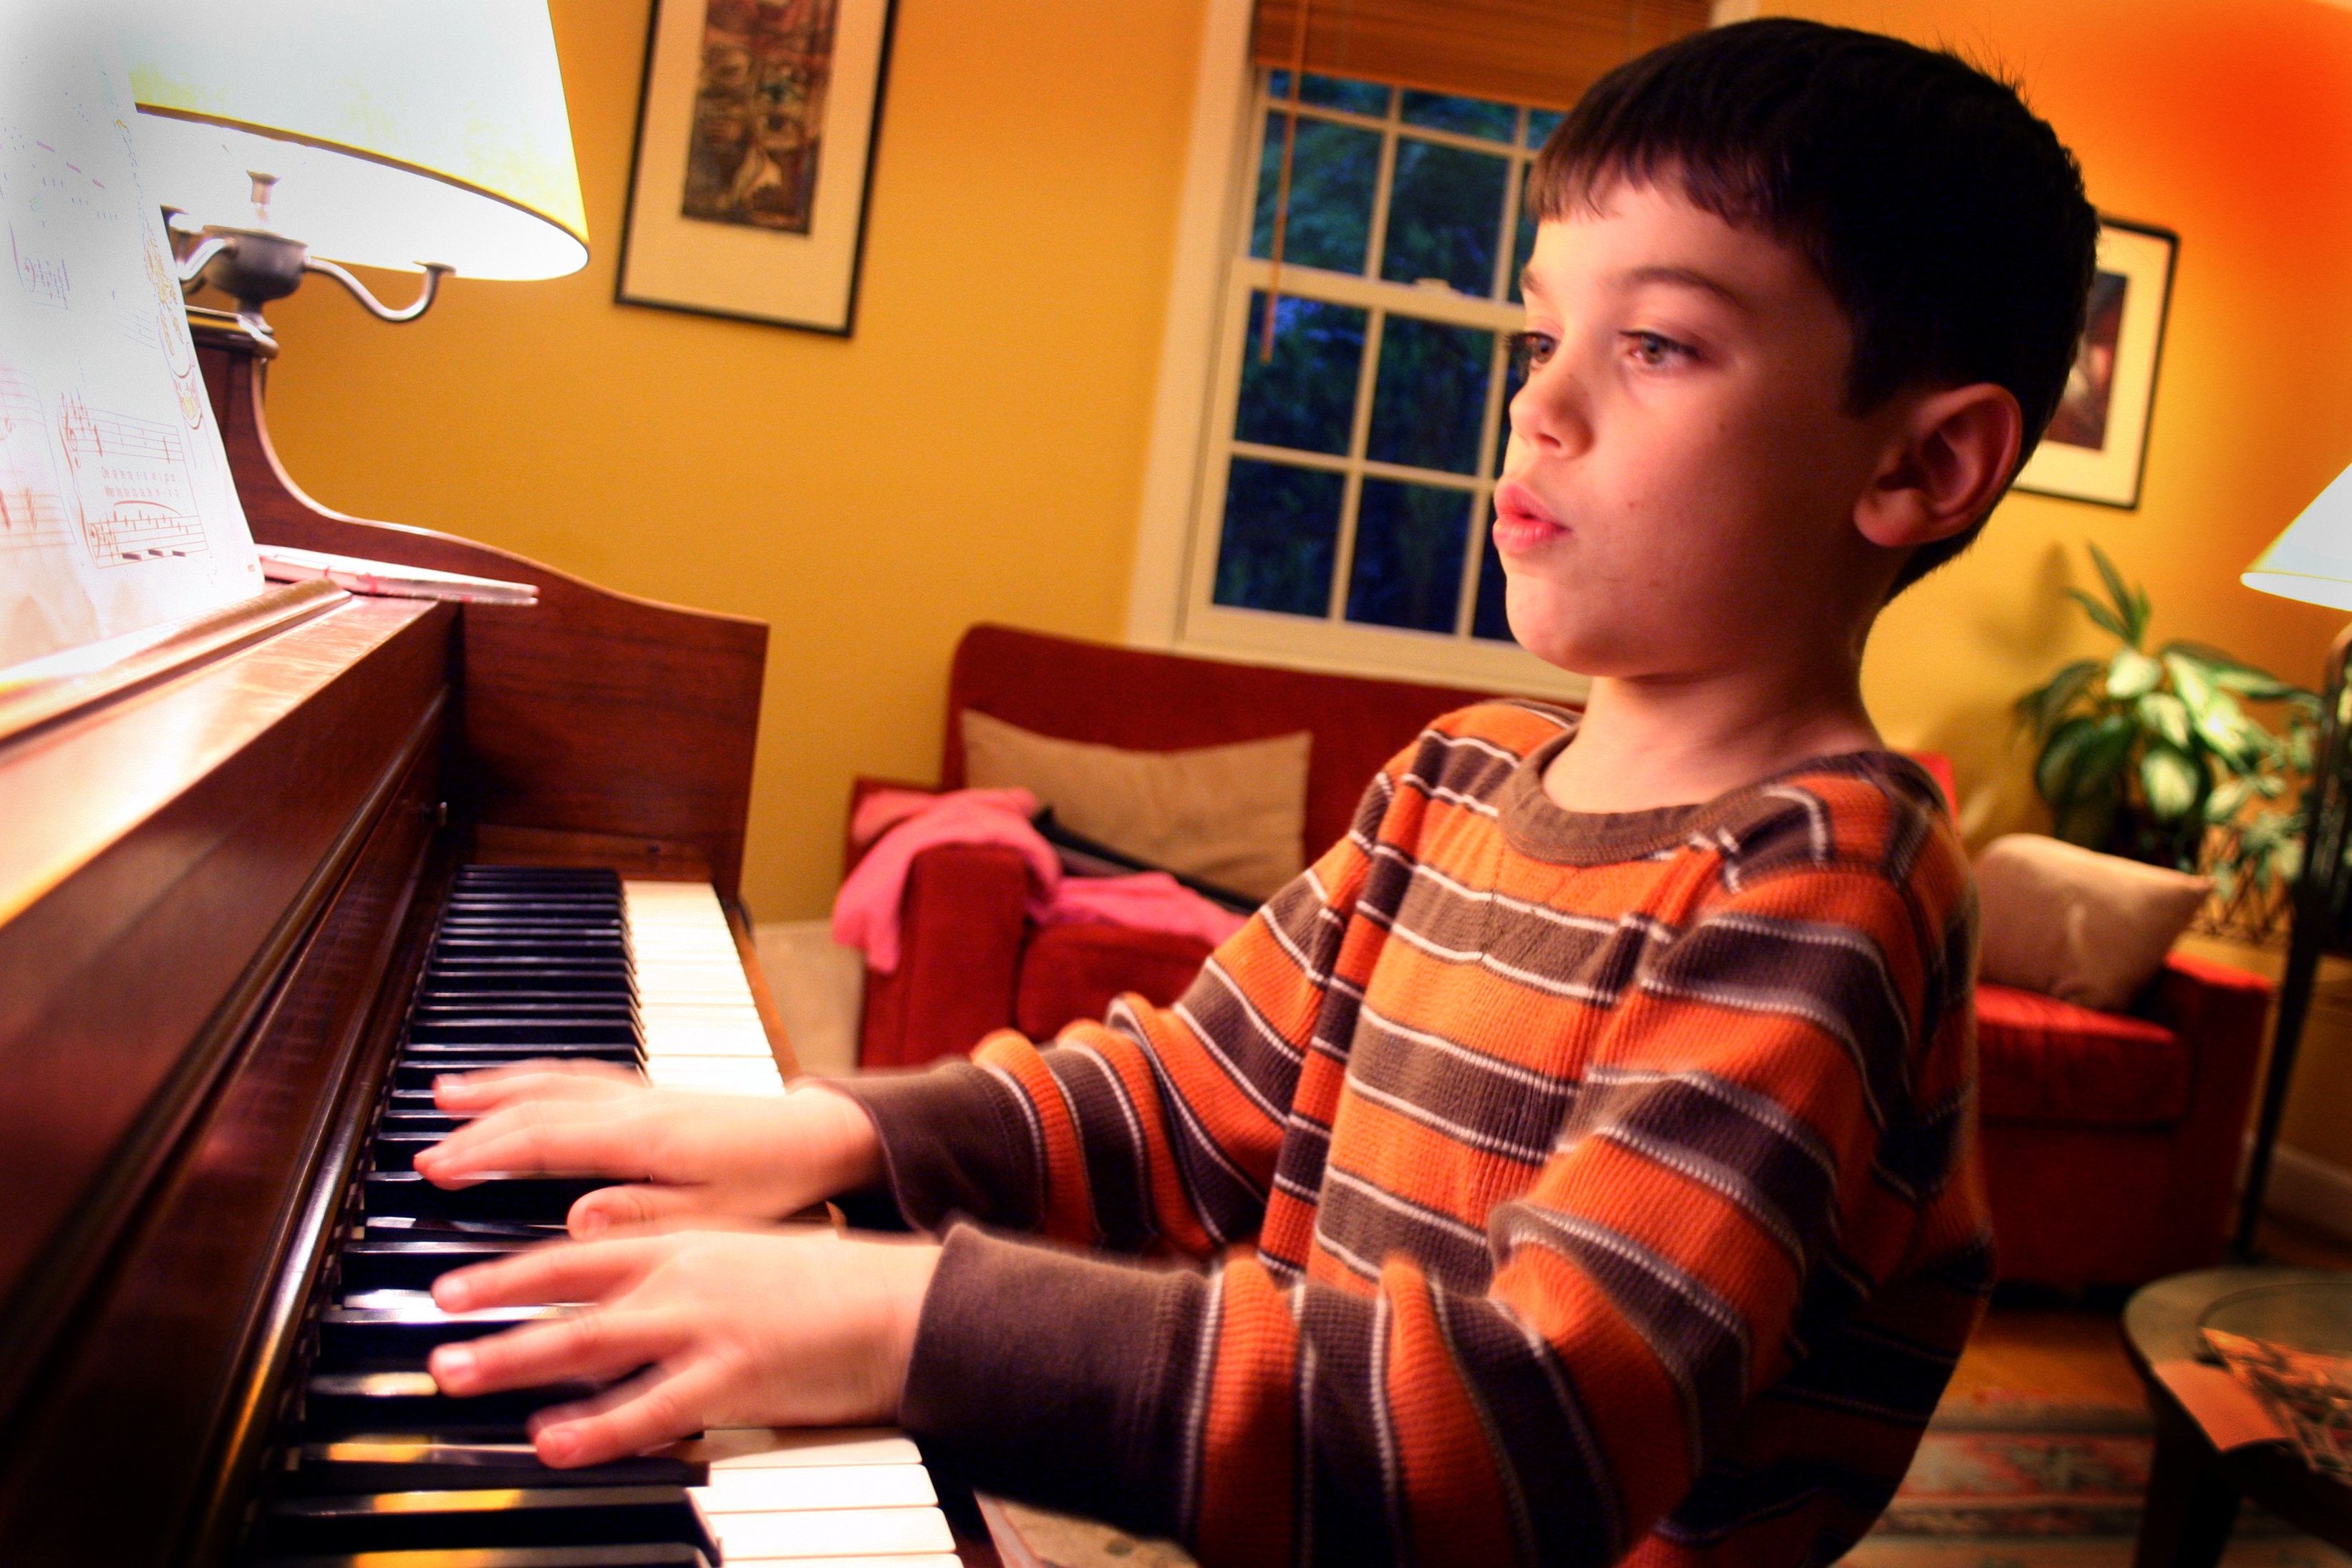 Figure 2: Practice at the piano. In the automation stage, the eyes and the hands operate on a delay deep enough that the player no longer perceives the link as effortful. Source: Wikimedia Commons / Public Domain.
Segment 4 — Automation (Year 1+): Quiet Re-acceleration
The autonomous stage in Anderson's model. The learner processes notes without conscious effort. Vision runs a beat or two ahead of the hands; pulse maintenance consumes almost no cognitive budget.
What is interesting here is that the curve subtly accelerates again. With cognitive resources free, the learner can absorb more information per session and raise difficulty and variety simultaneously. A learner who moved from 90% to 92% over a year can move from 92% to 96% over the next, often more.
The Plateau Is Part of the Shape, Not the End
From far away, the curve looks like its first segment. From up close, all you see is the plateau. Learners need a tool that shows them their position from far away. Weekly accuracy and reaction-time logs, plotted over a month, three months, a year — that single dashboard cuts dropout in the plateau segment substantially.
Noteflex was designed to make this curve visible to the learner. Every session logs accuracy and reaction time at millisecond resolution, and the accuracy of the learner's weakest notes is tracked separately. When surface accuracy stalls but weak-note accuracy is climbing, the learner can see — in data, not in feel — that automation is happening underneath. Learners who can see the shape of the curve don't quit at month six.